This page provides quick links to climate information to help landscape architects access relevant data for their projects. While much climate information is available through various sources, our survey of landscape architects found that practitioners desired easy access to locally specific data. The link here to the New York Times provides basic answers to questions about climate change. In Florida, sea levels are expected to rise by approximately 1 meter by the year 2100, resulting in increased flooding and saltwater intrusion into freshwater supplies. Though temperatures are expected to generally rise, temperature extremes may also increase in frequency, in addition to droughts and extreme precipitation events. This is due in part to the likelihood of more intense storms. A summary of these projections for Florida can be found here. All of these changes will affect water supplies, plant distribution and hardiness, and the distribution and impacts from invasive species.
It is difficult to locate data that is locally relevant for a broad range of landscape architects due to the broad range of project types and locations that landscape architects work on. However, the links below include good sources of data on sea-level rise, precipitation, and temperature change that may be useful at least as a reference.
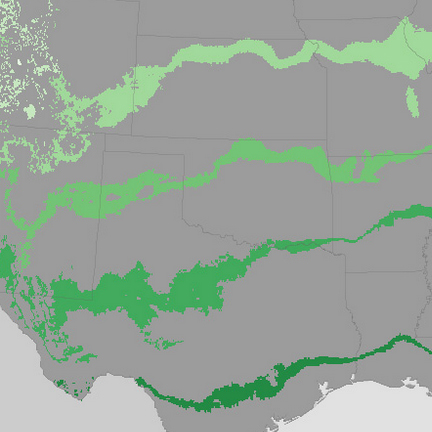
This interactive map allows users to find plant hardiness zones based on zip codes. It also provides links for state-level maps. Plant hardiness zones have shifted northward and upward in many locations when maps from different periods are compared based on data from the National Oceanic and Atmospheric Administration (NOAA). The maps here show those changes, and the pages here and here provide additional explanation of the data and changes.

This link provides information from the 4th National Climate Assessment, as well as other data collected by the U.S. Global Change Research Program, with participation and support from 13 federal government agencies. Another good source of information is the National Oceanic and Atmospheric Administration global climate change page here.


This interactive map displays the impact of sea level rise up to six feet. It also displays vulnerability, marsh migration, flood frequency, and other data. Alternate sources of data include the Climate Central Surging Seas Risk Finder, the GeoPlan Sea Level Scenario Planning Sketch Tool, as well as Florida International University. None of these resources are ideal for site specific analyses due to limitations in data resolution. However a site specific assessment of potential inundation can be completed using contour data and by making an adjustment for high tide. A reasonable estimate of potential sea level rise is 1 meter by 2100. Tidal data and information on historic sea level trends can be obtained here.

This site displays storm surge, sea level rise, coastal flooding, and Federal Emergency Management Agency (FEMA) flood zone data.

A variety of other online tools and resources are available from organizations including the NOAA Coastal Services Center, the U.S. Global Change Research Program, The Nature Conservancy, and other organizations. As always, it is important to verify that data and sources are reliable and based on sound science.
Image Sources: National Oceanic and Atmospheric Administration (NOAA) and the U.S. Global Climate Change Research Program